Average Salary in US
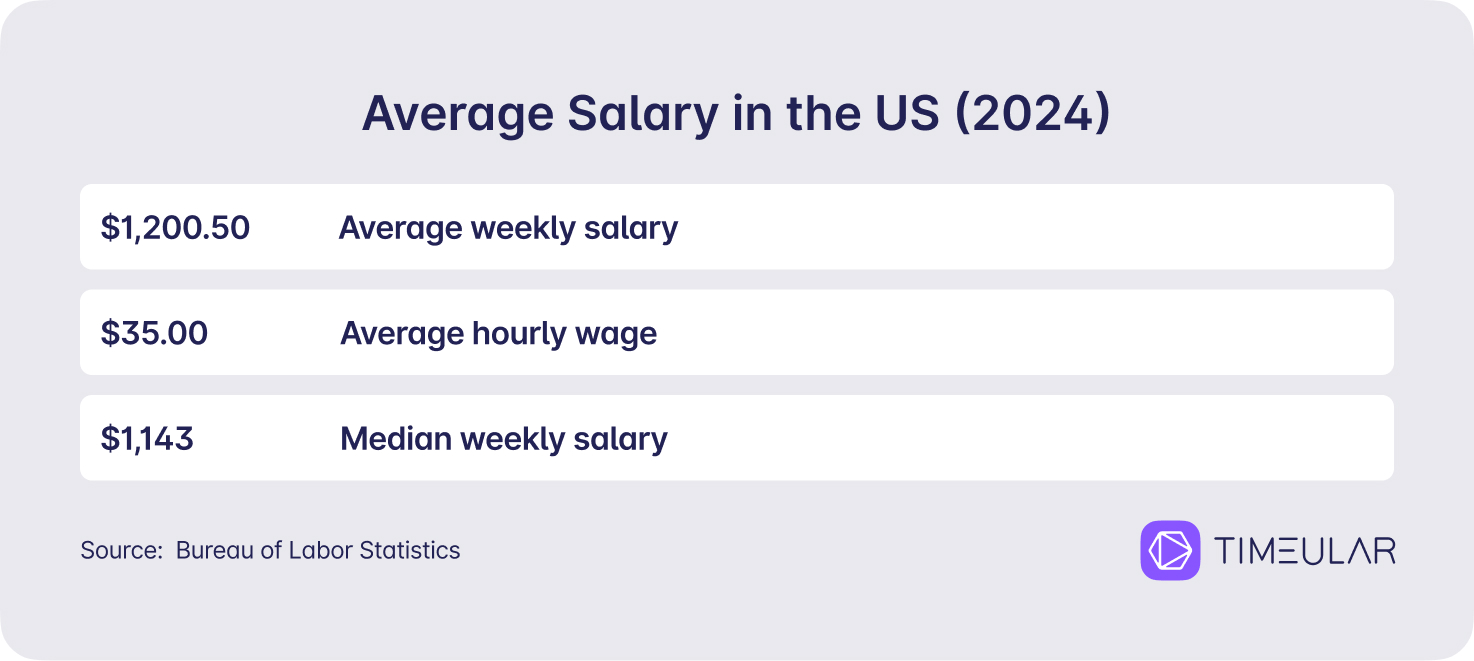
As of June 2024, the average salary in US was $1,200.50 per week and $35.00 per hour (Source: Bureau of Labor Statistics). In May 2023, the average annual salary was $65,470 (Source: Bureau of Labor Statistics).
In this article, we will shed light on average salaries in America by region, age, education level, ethnicity, and gender, based on the latest data and labor statistics from the Bureau of Labor Statistics and the US Department of Labor.
Key labor statistics
- Average salary in United States per week: $1,200.50 for all employees.
- Average hourly wage: $35.00
- Median salary per week: $1,143 for all full-time workers.
- Gender pay gap: Women earn $1,017 per week, which is 81.2% of the $1,253 men earn.
- Racial disparities: Median earnings vary greatly by race and ethnicity, with Asians earning the most at $1,500 and Hispanics the least at $903 per week.
- Education: Workers with a bachelor’s degree or higher earn $1,684 per week, those without a high school diploma earn $726. The top 10% of male workers made $4,786 or more per week, and the top 10% of female workers made $3,423 or more.
- Occupation: Management and professional occupations earn the most, at $1,877 for men and $1,389 for women, while service occupations earn the least, at $809 for men and $706 for women.
Median salary breakdown
In Q2 2024, the median pay for full-time wage and salary workers in the US was $1,143 per week. That’s a 3.9% increase from last year, ahead of the 3.2% increase in the Consumer Price Index for All Urban Consumers (CPI-U) over the same period (Source: Bureau of Labor Statistics).
Men earn more than women: The median income for men is $1,253 per week, compared to $1,017 for women.

Minimum wage
In the US, the minimum wage is set by federal, state, and local laws. The Fair Labor Standards Act (FLSA) sets the federal baseline, which, as of June 2024, is $7.25 per hour.
States and localities can set higher minimum wages based on regional economic conditions and cost of living. These rates are updated periodically based on legislative changes and inflation.
As of June 2024, the federal minimum wage is $7.25 per hour, but certain states and municipalities have raised their minimum wage to better match local conditions (Source: U.S. Department of Labor).
Minimum wage by state
The District of Columbia has the highest minimum wage at $17.50 per hour due to its high cost of living and strong labor market. California is second with a minimum wage of $16.00 per hour, with strict overtime rules. Other high minimum wage states are Washington at $16.28, Connecticut at $15.69, and New York, where the rate is $15.00 to $16.00 depending on the county.
On the other end, some states stick to the federal minimum wage of $7.25 per hour or have even lower state-mandated wages. States like Georgia, Wyoming, and Oklahoma have minimum wages as low as $5.15 and $2.00 but are required to pay the federal minimum wage to covered employees.
Alabama, Louisiana, Mississippi, South Carolina, and Tennessee have no state minimum wage laws, so they default to the federal rate. These disparities result in much lower earnings in these states than those with higher minimum wage rates.
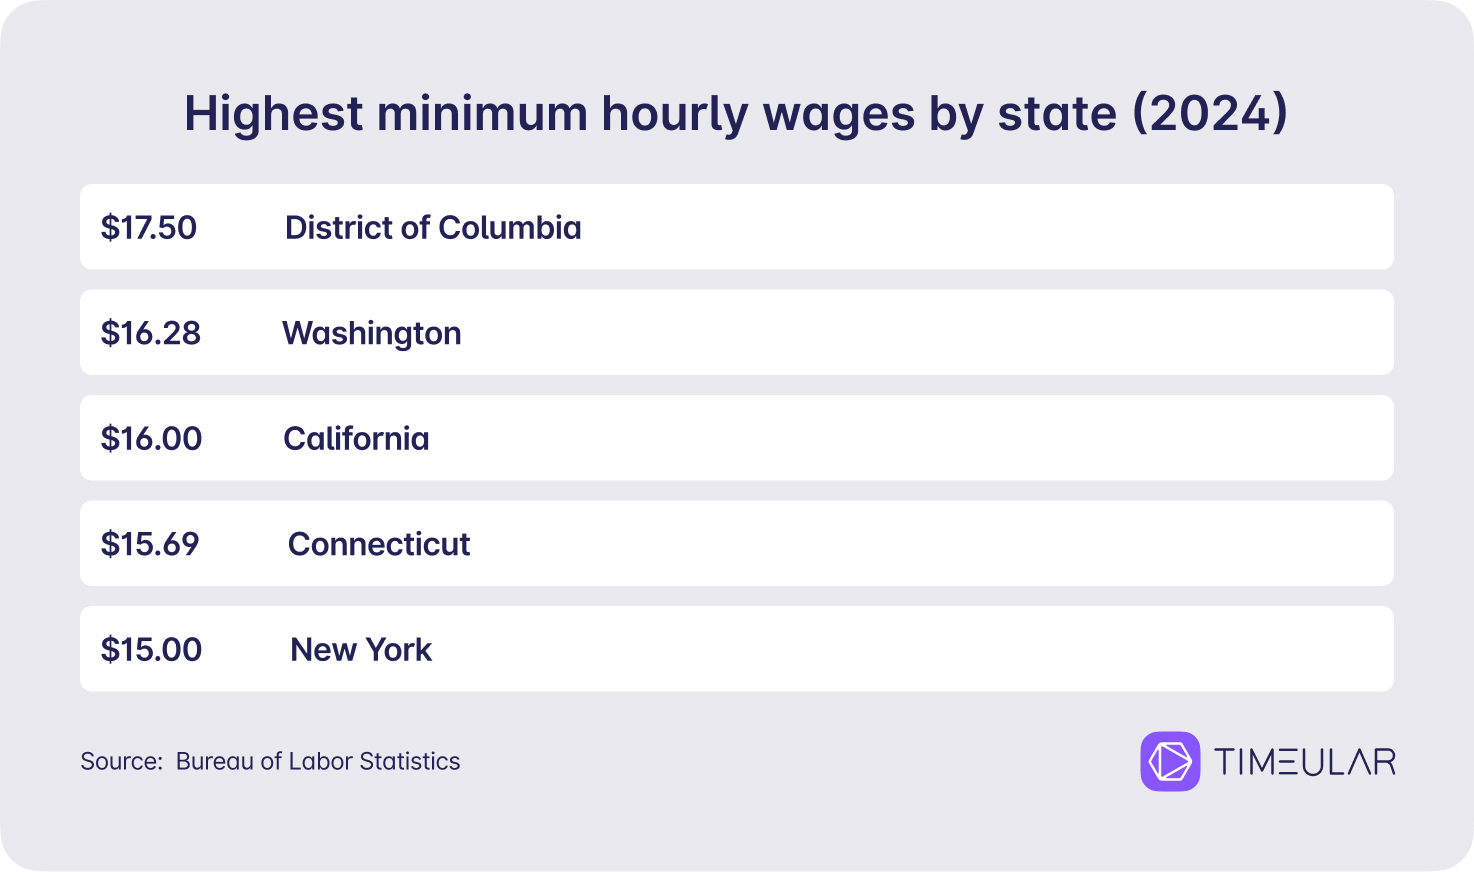
Highest minimum wages:
- District of Columbia – $17.50 per hour
- Washington – $16.28 per hour
- California – $16.00 per hour
- Connecticut – $15.69 per hour
- New York – $15.00 per hour (except in certain counties)
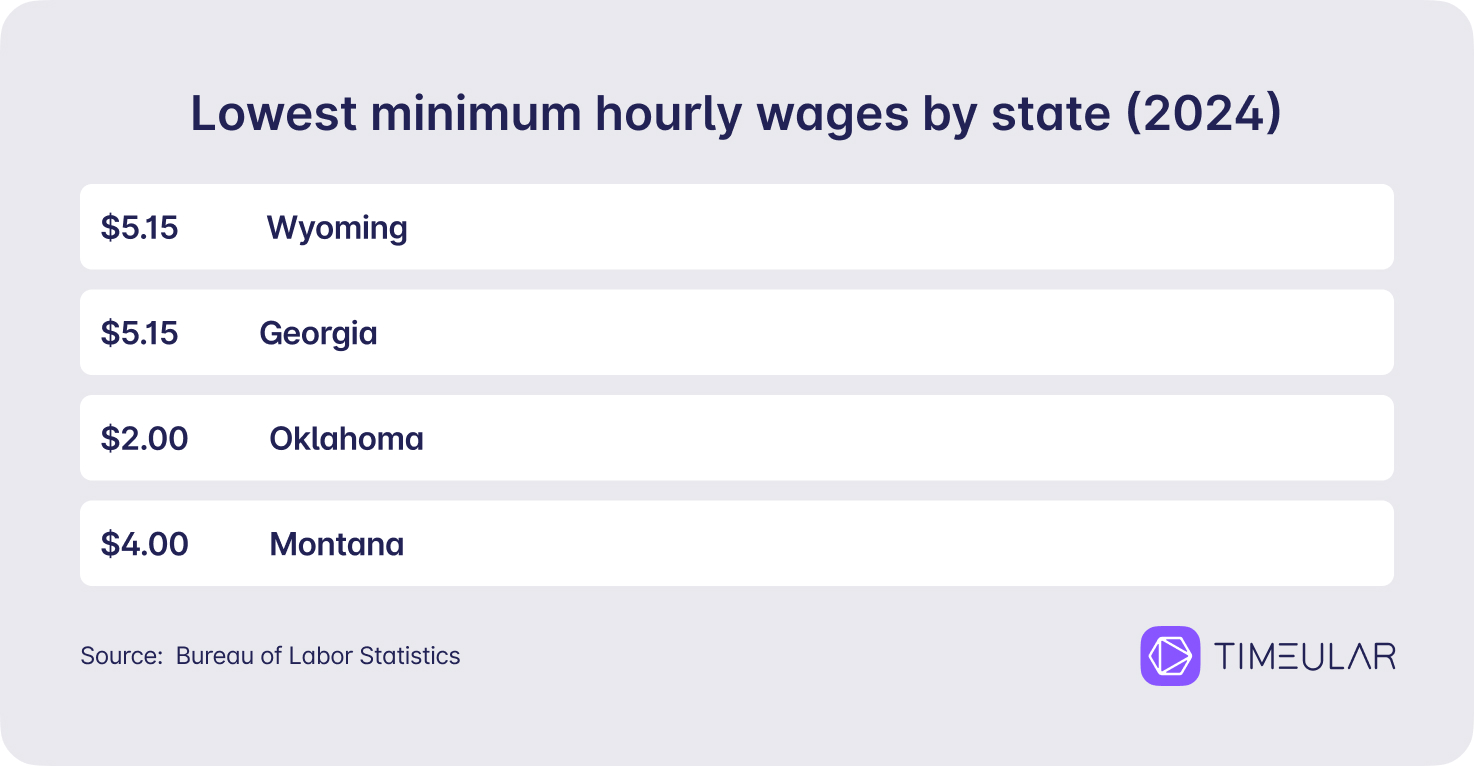
Lowest minimum wages:
- Wyoming – $5.15 per hour
- Georgia – $5.15 per hour
- Oklahoma – $2.00 per hour (for certain employers)
- American Samoa – Special rates apply (generally lower)
- Montana – $4.00 per hour (for certain small businesses)
Factors affecting average salary in the US
- Regional differences: Salaries vary widely across regions due to differences in cost of living and local economic conditions, which impact the average wage. High-cost areas like San Francisco and New York City pay higher salaries to match the cost of living, while lower-cost areas like Mississippi and West Virginia have lower wages.
- Education level: Higher education leads to higher earnings. Workers with a bachelor’s degree or higher earn much more than those with a high school diploma or less, reflecting the value of education in the job market.
- Occupation: Occupation plays a big role in salaries. Management and professional jobs pay more than service or lower-skilled jobs, reflecting the responsibilities and skill requirements.
- Age and experience: Earnings increase with age and experience. Older and more experienced workers earn more due to their accumulated skills and knowledge, although trends vary by industry and job.
- Gender: Gender pay gaps persist. Women earn less than men. As of mid-2024, women earn about 81.2% of what men make across all industries and jobs.
- Ethnicity: There are significant racial and ethnic disparities in earnings. For example, Asian workers earn the most, while Hispanic workers earn the least. These differences reflect broader socio-economic factors and access to opportunities.
Regional salary differences
- San Francisco Bay Area: This area is known for very high salaries, especially in tech, due to the high cost of living. Software engineers and tech professionals earn some of the highest salaries in the country, partly to offset the high housing costs and general expenses in the area.
- New York City: NYC pays competitive salaries in finance, law, and media to match the higher cost of living. While wages are high, so are housing costs and everyday expenses, making it a high stakes financial environment.
- Dallas-Fort Worth: This region has strong salaries in tech and telecommunications but a lower cost of living compared to major coastal cities. It is growing and has an affordable housing market.
- Chicago: This area pays competitive salaries in finance, healthcare, and manufacturing. Although not as high as coastal hubs, wages are substantial compared to the region’s cost of living, which is moderate compared to San Francisco or New York.
- Detroit: Here, salaries are lower compared to national averages due to the city’s economic restructuring and lower cost of living. Despite recent revitalization efforts, compensation is below that of more prosperous metropolitan areas.
- Raleigh-Durham: The region is known for strong salaries in tech and research due to the presence of major universities (Duke University, North Carolina State University)and tech companies (Research Triangle Park and companies like Lenovo, IBM, and Cisco Systems). Its balanced cost of living and competitive wages attract professionals from various industries.
Highest paying states
In Q1 2024, personal income in current dollars increased in all 50 states and DC. The annual growth rate varied widely, with South Carolina up 9.5% and North Dakota up 0.6%.
Here are some of the highest-paying states in the U.S., based on the highest average salaries:
- California
- New York
- Massachusetts
- Washington
- Maryland
- New Jersey
- Alaska
- Colorado
Lowest paying regions
Mississippi, West Virginia, and Arkansas have the lowest median wages, often due to lower cost of living and more lower-paying industries.
Here are the lowest-paying regions in the US by average annual wages:
- Mississippi
- West Virginia
- Arkansas
- New Mexico
- Alabama
- South Carolina
- Oklahoma
Average salaries by industry
In the second quarter of 2024, full-time American workers in management, professional, and related occupations earned the most – $1,877 for men and $1,389 for women. Those in service jobs earned the least – $809 for men and $706 for women.
Here are the median salary per week for men and women in specific occupations for the second quarter of 2024
| Occupation | Median Weekly Earnings (Men) – 2nd 2024 | Median Weekly Earnings (Women) – 2nd 2024 |
| Management, professional and related occupations | $1,877 | $1,389 |
| Management, business and financial operations | $1,899 | $1,527 |
| Professional and related occupations | $1,843 | $1,287 |
| Service occupations | $809 | $706 |
| Sales and office occupations | $1,157 | $875 |
| Sales and related occupations | $1,321 | $876 |
| Office and administrative support occupations | $1,012 | $874 |
| Natural resources, construction and maintenance | $1,053 | $790 |
| Farming, fishing and forestry occupations | $699 | $705 |
| Construction and extraction occupations | $1,016 | $804 |
| Installation, maintenance and repair occupations | $1,168 | $850 |
| Production, transportation and material moving | $951 | $741 |
| Production occupations | $998 | $739 |
| Transportation and material moving occupations | $901 | $742 |
Gender wage gap
In the US, the gender pay gap is still a big problem, women earn $1,017 per week compared to $1,253 for men. That means women earn about 81.2% of what men earn.
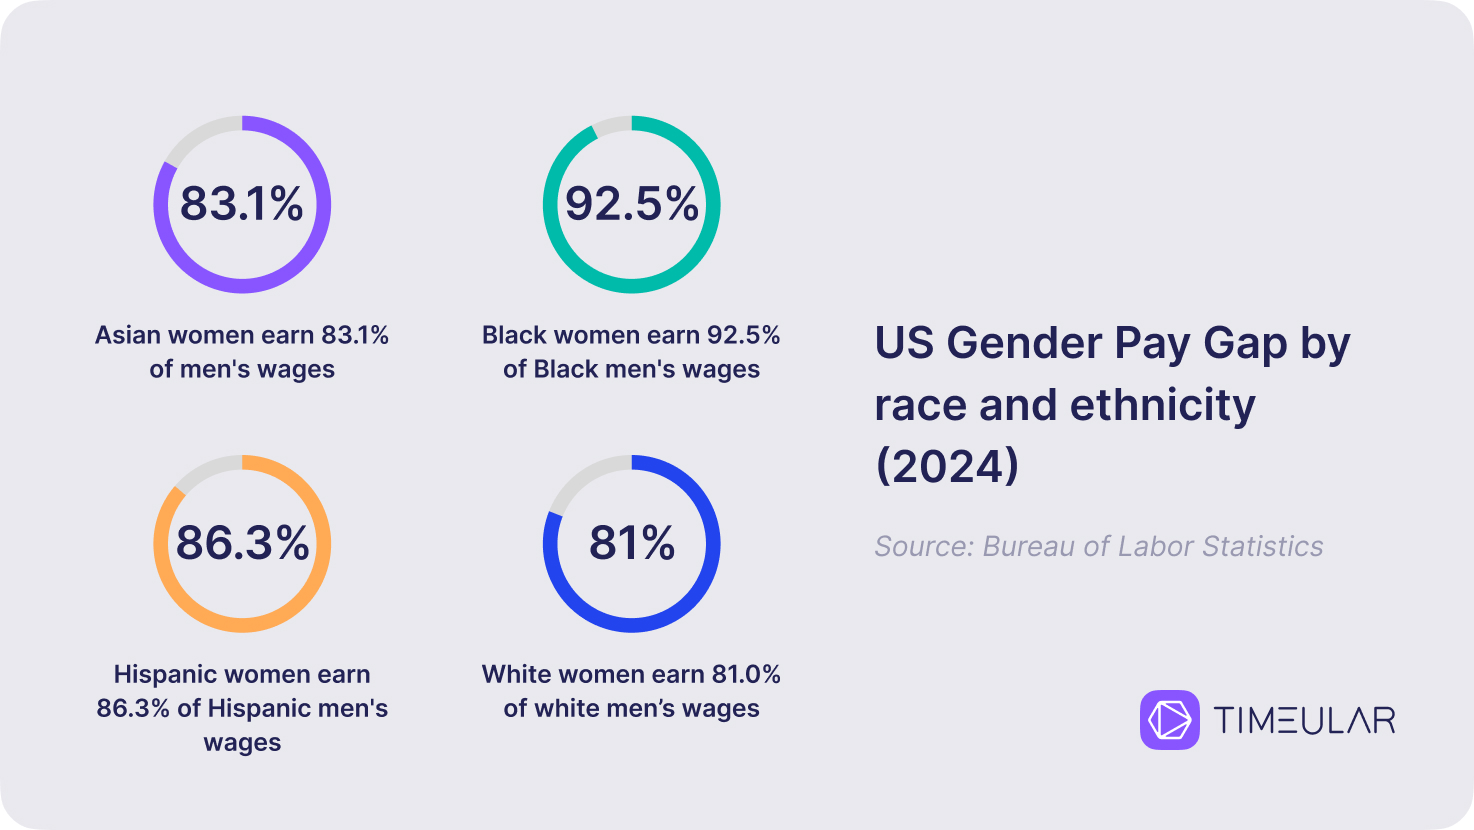
The gap varies by race and ethnicity: White women earned 81.0% of what their male counterparts earned, while Black women earned 92.5%, Asian women earned 83.1%, and Hispanic women earned 86.3%.
Despite efforts to close the gap, there are still big gaps across all demographics.
Several efforts have been made to close the gender pay gap:
- The Paycheck Fairness Act has been introduced in Congress multiple times to strengthen wage discrimination protections and require more transparency in pay practices.
- Many states and localities have also taken action, such as requiring employers to report salary data by gender and race to identify and fix pay gaps.
- Companies are starting to do pay equity audits and commit to equal pay principles, often because of public pressure and corporate social responsibility goals.
Despite all these efforts, progress has been slow, and the systemic issues that contribute to the gender pay gap, like occupational segregation and differences in work experience, still affect women’s earnings.
More advocacy and policy changes are needed to close the gap and get pay equity for all workers.
Average salary by age
In Q2 2024, median weekly earnings for part-time workers in the US varied by age group. Overall, the median weekly earnings for all part-time workers went up from $358 in Q2 2023 to $379 in Q2 2024.
- For men, the median weekly earnings went up slightly from $357 to $363. Younger men 16-24 earned $289 per week, up from $283 the previous year. Men 25 and over went down from $433 to $427 per week.
- For women, the median weekly earnings went up more, from $358 to $388. Younger women 16-24 earned $274 per week, up from $283 the previous year. Women 25 and over earned more, from $420 to $444 per week.
This shows that part-time earnings generally go up with age because of more experience and possibly higher skills, though older workers may see different trends based on their work patterns and opportunities.
Average salary by education
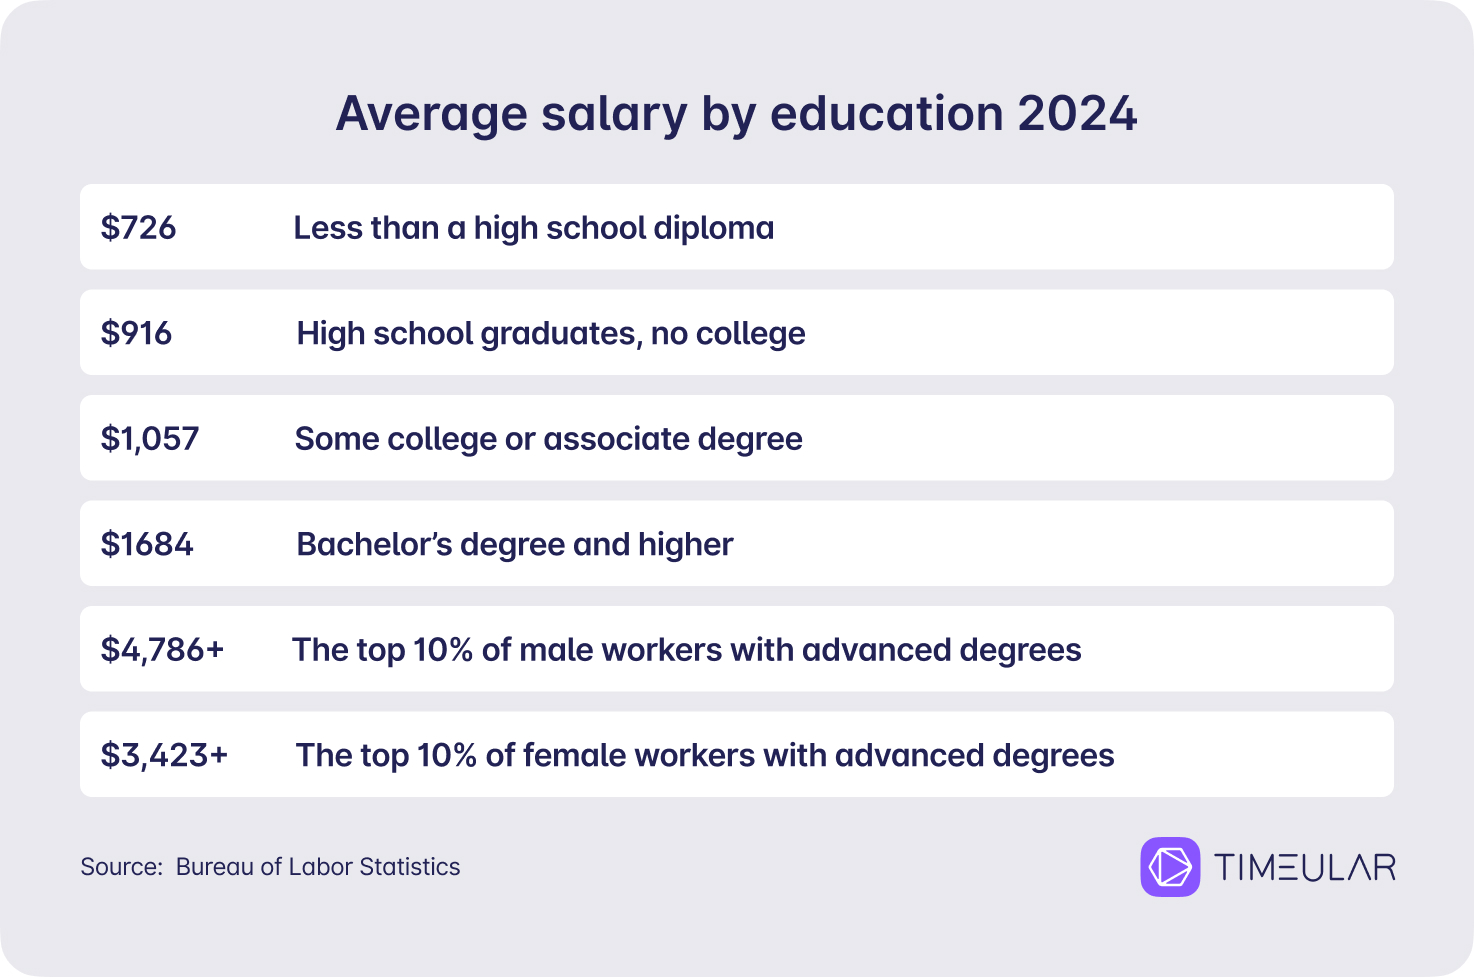
In Q2 2024, earnings in the US showed a clear education correlation with median income.
- Full-time workers 25 and over without a high school diploma earned $726 per week. High school graduates who didn’t pursue further education earned $916 per week.
- Those with at least a bachelor’s degree saw a big jump, with median earnings of $1,684 per week.
- The top 10% of male workers with advanced degrees earned $4,786 or more per week. The top 10% of female workers with advanced degrees earned $3,423 or more per week.
These numbers show the big impact of education on earnings. The data shows that while higher education leads to higher wages, there are still gaps, especially between genders. For example, even the top 10% of women with advanced degrees earn less than their male counterparts, showing there’s still income gaps in the workforce.
Net salary calculation
Net salary is the amount an employee takes home after all deductions are made from their gross salary.
Here’s how it’s done in the United States:
- Gross salary: This is the total amount earned before any deductions. It includes base salary, overtime pay, bonuses, and any other forms of compensation.
- Federal income tax: The amount withheld is based on the employee’s W-4 form, which shows their filing status and allowances. The IRS has tax brackets that determine the percentage of income to be withheld.
- State and local taxes: Depending on where you live, state and local taxes may also be deducted. These rates and rules vary greatly from state to state or locality to locality.
- Social Security tax: This is a federal tax that funds Social Security. For 2024, employees pay 6.2% of their gross salary up to a certain income limit ($168,600).
- Medicare tax: This federal tax funds Medicare. Employees pay 1.45% of their gross salary, with an additional 0.9% surtax on high earners making over $200,000.
- Other deductions: This includes contributions to retirement plans (like a 401(k)), health insurance premiums, life insurance, union dues, and any other voluntary or mandatory deductions.
- Adjustments: Any other adjustments, like garnishments for child support or student loans, are also factored in.
Average wage growth
Average wages have been growing over time. Median weekly earnings in Q2 2024 were 4.1% higher than in Q2 2023.
However, there are big disparities when looking at different demographics. Women, for example, earn 81.2% of what men earn. While wages are going up, the gender pay gap persists. Black women earn 92.5% of what Black men earn and Hispanic women earn 86.3% of what Hispanic men earn.
According to the Bureau of Economic Analysis, in Q1 2024 earnings rose in 47 states and DC, up 4.7% nationally. The percentage change in earnings varied greatly, from 7.2% in Alabama and Delaware to -4.5% in North Dakota. Earnings grew in 21 of 24 industries. Earnings were the main driver of personal income growth in 26 states and DC.
In Delaware, where personal income grew the second most, the increase was mostly due to real estate and rental and leasing and state and local government.
In Alabama, where personal income grew the third most, it was mostly due to farm earnings. In North Dakota, where personal income grew the least, farm earnings declined significantly.
Income inequality in the US
Income inequality in the US is stark, with significant disparities in wealth and income distribution, exacerbated by educational and policy factors:
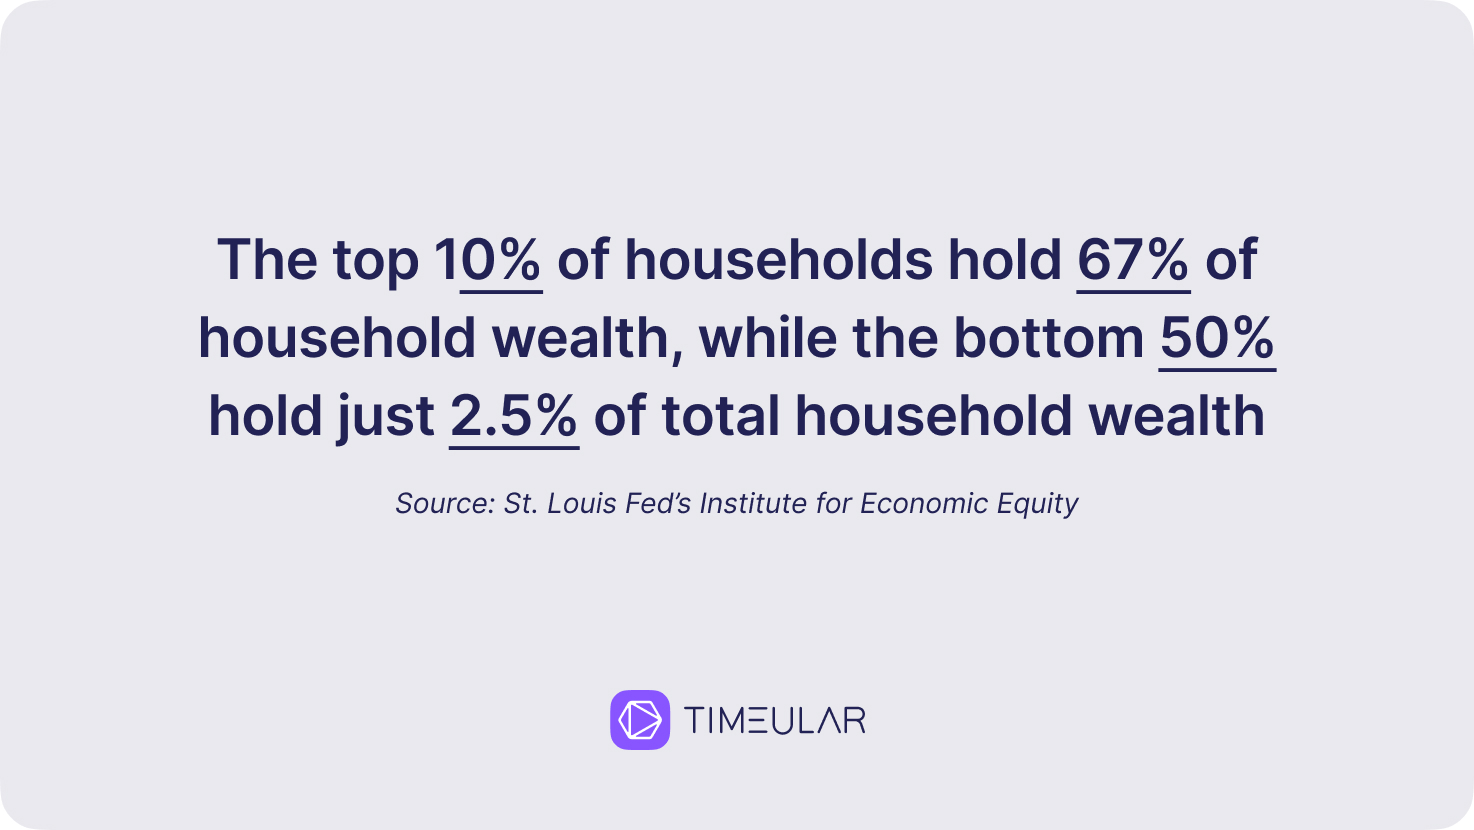
- According to the St. Louis Fed’s Institute for Economic Equity, the top 10% of households hold 67% of household wealth, while the bottom 50% hold just 2.5% of total household wealth (Source).
- According to the Economic Policy Institute, from 1979 to 2021, while wages for the bottom 90% grew by just 28.7%, those for the top 1% and top 0.1% soared by 206.3% and 465.1%, respectively (Source).
- Educational disparities make it worse. As stated by the Bureau of Labor Statistics, the lower the education, the lower the income (Source).
- Federal tax policy changes have mostly benefited the wealthy, according to the Tax Policy Center, widening the gap (Source).
Compared to other countries
As of May 2023, the average salary in the United States was $65,470, reflecting its strong economy and high standard of living. When compared to other countries, the US average salary is notably higher, highlighting the economic disparities and varying standards of living across the globe.
To provide a clearer understanding, let’s compare the average salaries in the US with those in China, Germany, France, Russia, Mexico, and Canada.
| Country | Average Salary (USD) |
| United States | $65,470 |
| Germany | $54,000 |
| Canada | $55,000 |
| France | $45,000 |
| China | $13,000 |
| Russia | $7,500 |
| Mexico | $10,000 |
Sources:
- https://www.bls.gov/ces/data/employment-and-earnings/2024/summarytable_202406.htm
- https://www.bls.gov/news.release/pdf/wkyeng.pdf
- https://www.dol.gov/agencies/whd/minimum-wage/state
- https://www.bls.gov/oes/current/oes_nat.htm
- https://www.stlouisfed.org/institute-for-economic-equity/the-state-of-us-wealth-inequality
Read more:
- Average salary in Costa Rica
- Average salary in South Korea
- Average salary in Thailand
- Average salary in Canada
- Average salary in Switzerland
- Average salary in Germany
- Average salary in Japan
- Average salary in Mexico
- Average salary in Pakistan
- Average salary in Vietnam
- Average salary in Spain
- Average salary in Romania
- Average salary in France
- Average salary in Philippines
- Average salary in UK
- Average salary in Poland